NinjaTrader Half Day Fibonacci
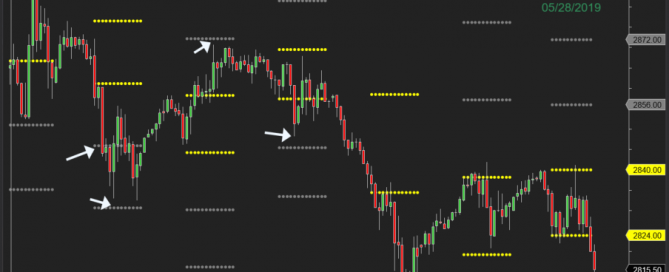
The Half Day Fibonacci Plotter plots the High and Low of strategic points in the Pre-market. These lines are extended to show possible targets above and below the two yellow lines. As you can see on this 60 minute chart when price passed the yellow lines the gray line target was either met or close … Continue reading NinjaTrader Half Day Fibonacci
Copy and paste this URL into your WordPress site to embed
Copy and paste this code into your site to embed