

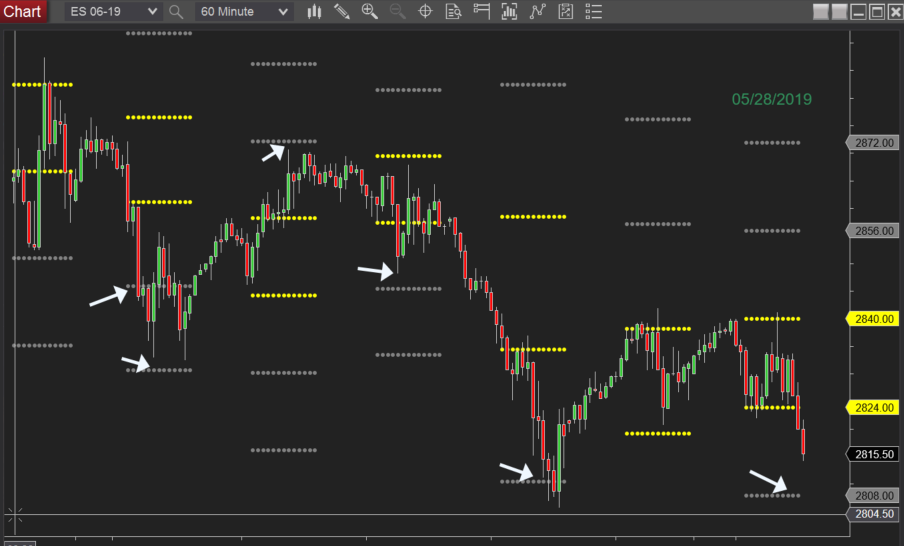
The Half Day Fibonacci Plotter plots the High and Low of strategic points in the Pre-market. These lines are extended to show possible targets above and below the two yellow lines. As you can see on this 60 minute chart when price passed the yellow lines the gray line target was either met or close to it. I took a screenshot of the current market for the last 7 days and as you can see on the current day it is headed towards the gray line which is at 2808.00 on 05/28/2019. Check your charts and see if price makes it to the gray line or close to the gray line.
Past Performance Is No Guarantee Of Future Results
Sale Price: $397
This Purchase is for 1 License for the Half Day Fibonacci Plotter.
To your Trading Success! The Master Money Bot Team